I am trying to set up xdebug on mamp pro with no success. I searched all over the internet, nothing helped me.
First I have tried just to uncomment the following line in php.ini:
zend_extension="/Applications/MAMP/bin/php/php5.4.4/lib/php/extensions/no-debug-non-zts-20100525/xdebug.so"
Next, I've tried the wizard: http://xdebug.org/wizard.php
Next, I've tried adding these lines to php.ini:
xdebug.default_enable=1
xdebug.remote_enable=1
xdebug.remote_handler=dbgp
xdebug.remote_host=localhost
xdebug.remote_port=9000
xdebug.remote_autostart=1
Nothing helps. I can't see xdebug in my phpinfo.
MAMP PRO Version: 2.1.1
PHP Version: PHP 5.4.4
Thanks!
Answer
Since release of MAMP 2.01 XDebug is already included.
Solved. Here's the tutorial that helped me:
Start MAMP
Edit php.ini template file through MAMP to enable the extension. Edit the template file via File -> Edit Template -> PHP -> PHP php.ini

Edit bottom of php.ini template file so that it ends up looking like if you want profile output
[xdebug]
zend_extension="/Applications/MAMP/bin/php/php5.3.6/lib/php/extensions/no-debug-non-zts-20090626/xdebug.so"
xdebug.profiler_enable = 1
xdebug.profiler_output_dir = "/tmp"
; DONT REMOVE: MAMP PRO php5.3.6.ini template compatibility version: 1
If you don’t want profile output and just want xdebug running then use
[xdebug]
zend_extension="/Applications/MAMP/bin/php/php5.3.6/lib/php/extensions/no-debug-non-zts-20090626/xdebug.so"
xdebug.profiler_enable = 0
xdebug.profiler_output_dir = "/tmp"
; DONT REMOVE: MAMP PRO php5.3.6.ini template compatibility version: 1
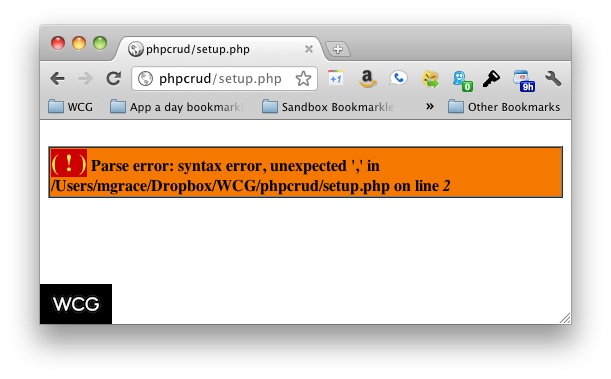
Now when you have errors, if they are sent to standard out, you will see something like this
My
php.inifile: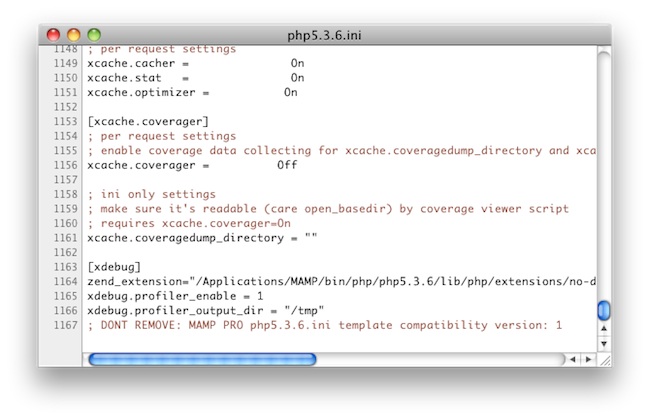
Save edited template and close edit window
Restart MAMP
Open MAMP’s WebStart page and navigate to PHPInfo tab. Check to make sure that Xdebug is running. Doing a search in the browser window for “Xdebug” makes this easy.
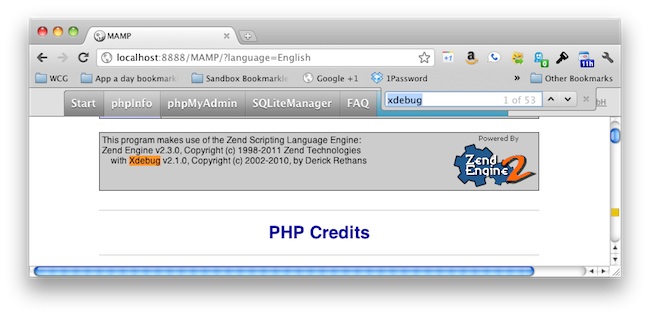
If you used the same settings that I have above, when you run PHP code, Xdebug will put the
cachegrind.outfiles in your ‘/tmp’ directory. Open your ‘/temp’ directory and run one of your PHP files to make sure it is working correctly. You can open the ‘/tmp’ directory in finder by opening the terminal and runningopen /tmp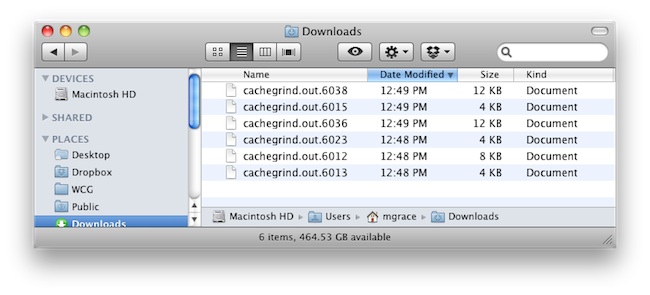
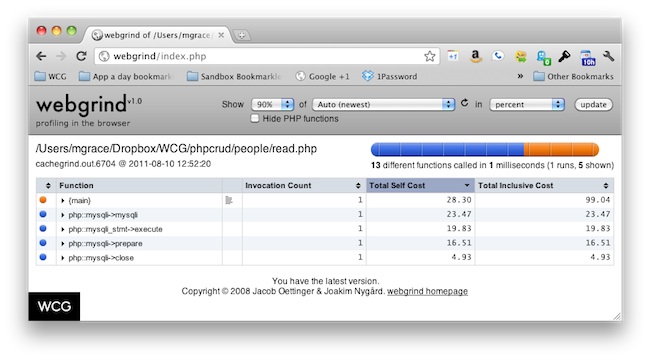
Now you can use any app that understands those cachegrind.out files to view the profile data. Apps like KCacheGrind (Linux/Windows, KDE), WinCacheGrind (Windows), xdebugtoolkit, and Webgrind. I went the simple route and used webgrind. Webgrind is a simple web based application that you can run locally on MAMP and it will look for the cachegrind.out files automatically with just one click. Continue for steps on setting up with webgrind.
Setup Webgrind host on MAMP to run Webgrind
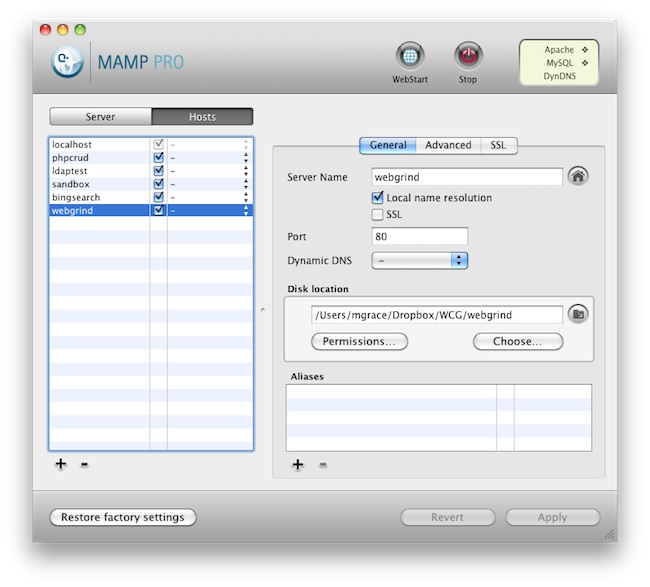
Visit webgrind url setup on your local MAMP installation. Mine was simply webgrind/
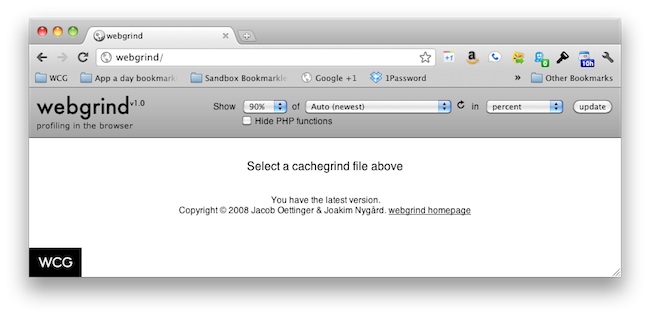
If you already have cachegrind output files you should be able to select the file in the “Auto (newest)” dropdown or leave it select at Auto and click update which will reveal the profile data

Throw a celebratory fist pump
