How to monitor Java memory usage?
We have a j2ee application running on Jboss and we want to monitor its memory usage. Currently we use the following code
    System.gc();
    Runtime rt = Runtime.getRuntime();
    long usedMB = (rt.totalMemory() - rt.freeMemory()) / 1024 / 1024;
    logger.information(this, "memory usage" + usedMB);
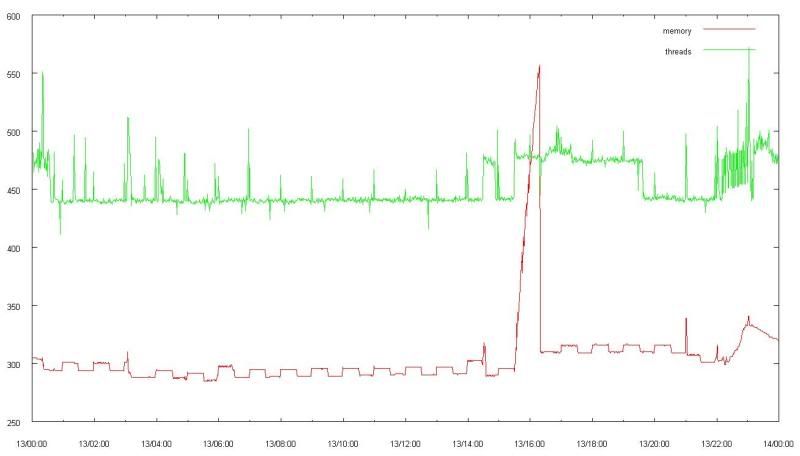
This code works fine. That means it shows memory curve which corresponds to reality. When we create a big xml file from a DB a curve goes up, after the extraction is finished it goes down.

A consultant told us that calling gc() explicitly is wrong, "let jvm decide when to run gc". Basically his arguments were the same as disscussed here. But I still don't understand:
- how can I have my memory usage curve?
- what is wrong with the explicit gc()? I don't care about small performance issues which can happen with explicit gc() and which I would estimate in 1-3%. What I need is memory and thread monitor which helps me in analysis of our system on customer site.
Answer
If you want to really look at what is going on in the VM memory you should use a good tool like VisualVM. This is Free Software and it's a great way to see what is going on.
Nothing is really "wrong" with explicit gc() calls. However, remember that when you call gc() you are "suggesting" that the garbage collector run. There is no guarantee that it will run at the exact time you run that command.
