How to use boost normal distribution classes?
I'm trying to use boost::normal_distribution in order to generate a normal distribution with mean 0 and sigma 1.
The following code doesn't work as some values are over or beyond -1 and 1 (and shouldn't be). Could someont point out what I am doing wrong?
#include <boost/random.hpp>
#include <boost/random/normal_distribution.hpp>

int main()
{
  boost::mt19937 rng; // I don't seed it on purpouse (it's not relevant)

  boost::normal_distribution<> nd(0.0, 1.0);

  boost::variate_generator<boost::mt19937&,
                           boost::normal_distribution<> > var_nor(rng, nd);

  int i = 0; for (; i < 10; ++i)
  {
    double d = var_nor();
    std::cout << d << std::endl;
  }
}
The result on my machine is:
0.213436
-0.49558
1.57538
-1.0592
1.83927
1.88577
0.604675
-0.365983
-0.578264
-0.634376
As you can see all values are not between -1 and 1.
Thank you all in advance!
EDIT: This is what happens when you have deadlines and avoid studying the theory before doing the practice.
Answer
The following code doesn't work as some values are over or beyond -1 and 1 (and shouldn't be). Could someont point out what I am doing wrong?
No, this is a misunderstanding of the standard deviation (the second parameter in the constructor1) of the normal distribution.
The normal distribution is the familiar bell curve. That curve effectively tells you the distribution of values. Values close to where the bell curve peaks are more likely than values far away (the tail of the distribution).
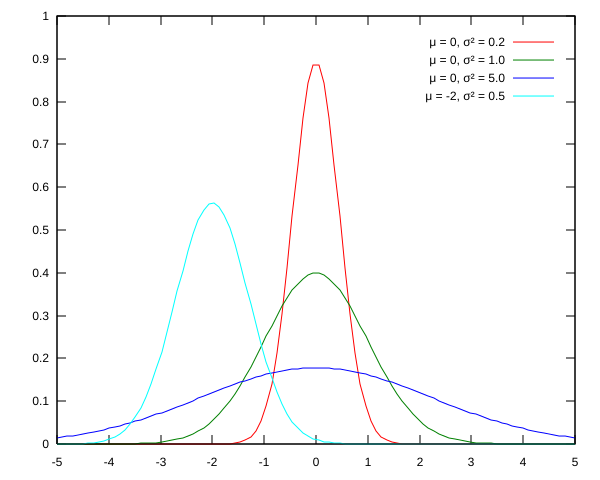
The standard deviation tells you how spread out the values are. The smaller the number, the more concentrated values are around the mean. The larger the number, the less concentrated values are around the mean. In the image below you see that the red curve has a variance (variance is the square of the standard deviation) of 0.2. Compare this to the green curve which has the same mean but a variance of 1.0. You can see that the values in the green curve are more spread out relative to the red curve. The purple curve has variance 5.0 and the values are even more spread out.
So, this explains why the values are not confined to [-1, 1]. It is, however, an interesting fact that 68% of the values are always within one standard deviation of the mean. So, as an interesting test for yourself write a program to draw a large number of values from a normal distribution with mean 0 and variance 1 and count the number that are within one standard deviation of the mean. You should get a number close to 68% (68.2689492137% to be a little more precise).

1: From the boost documentation:
normal_distribution(RealType mean = 0, RealType sd = 1);Constructs a normal distribution with mean mean and standard deviation sd.